 download pdf
  ARXIV
ARXIV peer review
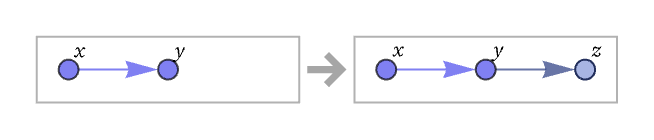
The core of our models are rules for rewriting collections of relations. A very simple example of a rule is:
Here x, y and z stand for any elements. (The elements they stand for need not be distinct; for example, x and y could both stand for the element 1.) The rule states that wherever a relation that matches {x,y} appears, it should be replaced by {{x,y},{y,z}}, where z is a new element. So given {{1,2}} the rule will produce {{1,2},{2,}} where is a new element. The label for the new element could be anything—so long as it is distinct from 1 and 2. Here we will use 3, so that the result of applying the rule to {{1,2}} becomes:
If one applies the rule again, it will now operate again on {1,2}, and also on {2,3}. On {1,2} it again gives {{1,2},{2,}}, but now the new node cannot be labeled 3, because that label is already taken—so instead we will label it 4. When the rule operates on {2,3} it gives {{2,3},{3,}}, where again is a new node, which can now be labeled 5. Combining these gives the final result:
(We have written this so that the results from {{1,2}} are followed by those from {{2,3}}—but there is no significance to the order in which the relations appear.)
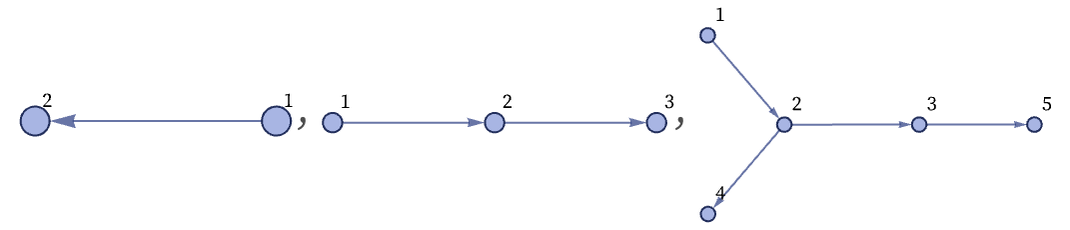
In graphical terms, the rule we have used is
and the sequence of steps is:
It is important to note that all that matters in these graphs is their connectivity. Where nodes are placed on the page in drawing the graph has no fundamental significance; it is usually just done to make the graphs as easy to read as possible.
Continuing to apply the same rule for three more steps gives:
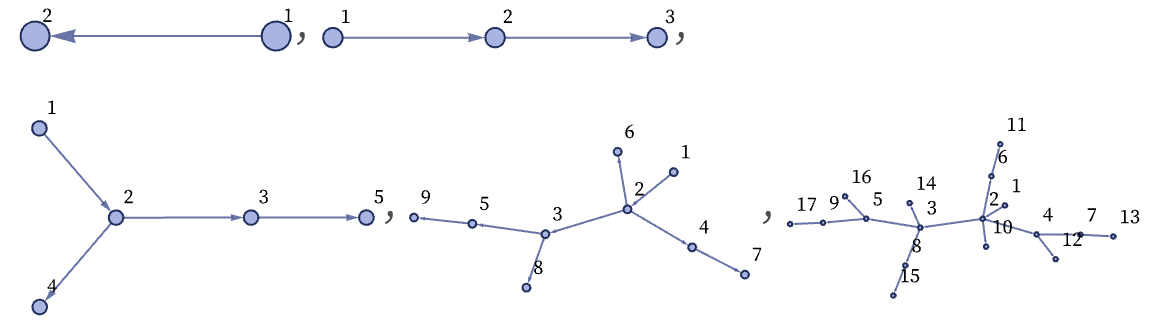
Laying out nodes differently makes it easier to see some features of the graphs:
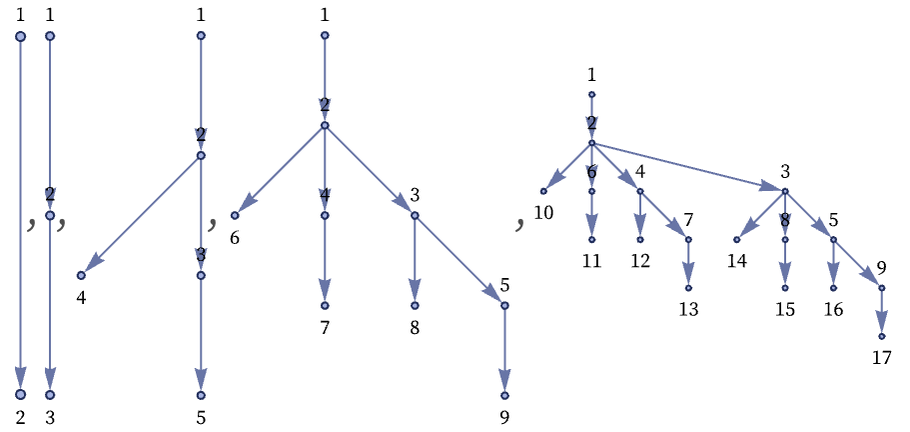
Continuing for a few more steps with the original layout gives the result:
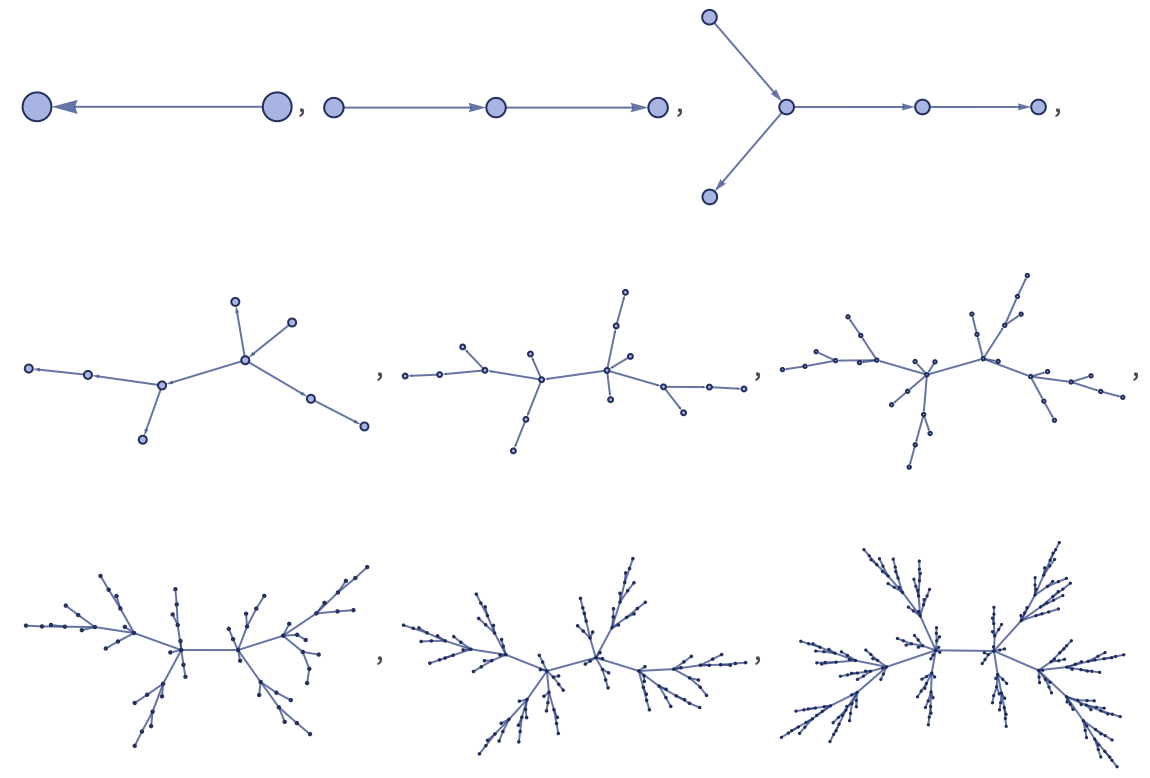
Showing the last 3 steps with the other layout makes it a little clearer what is going on:
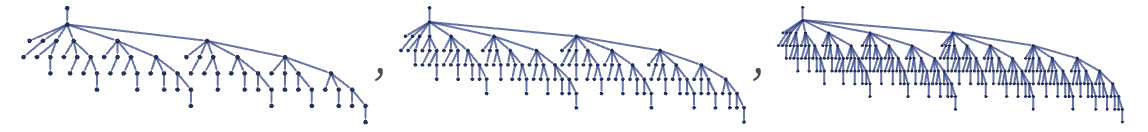
The rule is generating a binomial tree, with 2n edges (relations) and 2n+1 nodes (distinct elements) at step n (and with Binomial[n, s–1] nodes at level s).