One of the simplifying features of the rule BA AB discussed in the previous subsection is that for any finite initial condition, it always evolves to a definite final state after a finite number of steps—so it is possible to construct a complete multiway causal graph for it, and for example to verify that all the causal graphs for specific paths of evolution are identical.
But consider the rule {A BB, B A}:
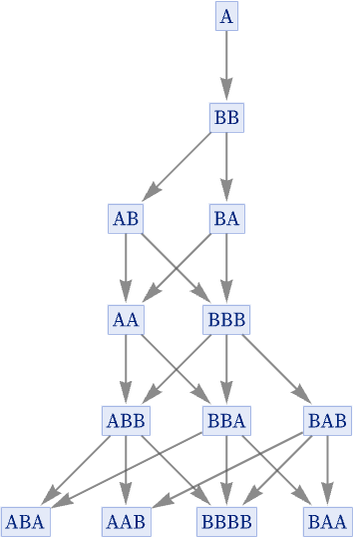
This rule is causal invariant, but never evolves to a definite state, and instead keeps growing forever. Including events in the evolution we get:
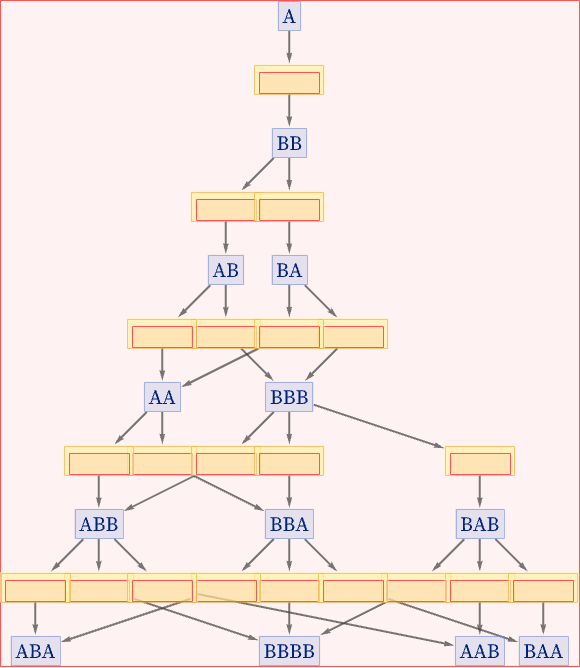
The corresponding multiway causal graph is:

And now if we extract possible individual causal graphs from this, we get:

These look somewhat similar, but they are not directly equivalent. And the reason for this has to do with how we are “counting steps” in the evolution of our system. If we evolve for longer, the effect becomes progressively less important. Here are causal graphs generated by a few different randomly chosen specific sequences of updates (each corresponding to a specific path through the multiway system):
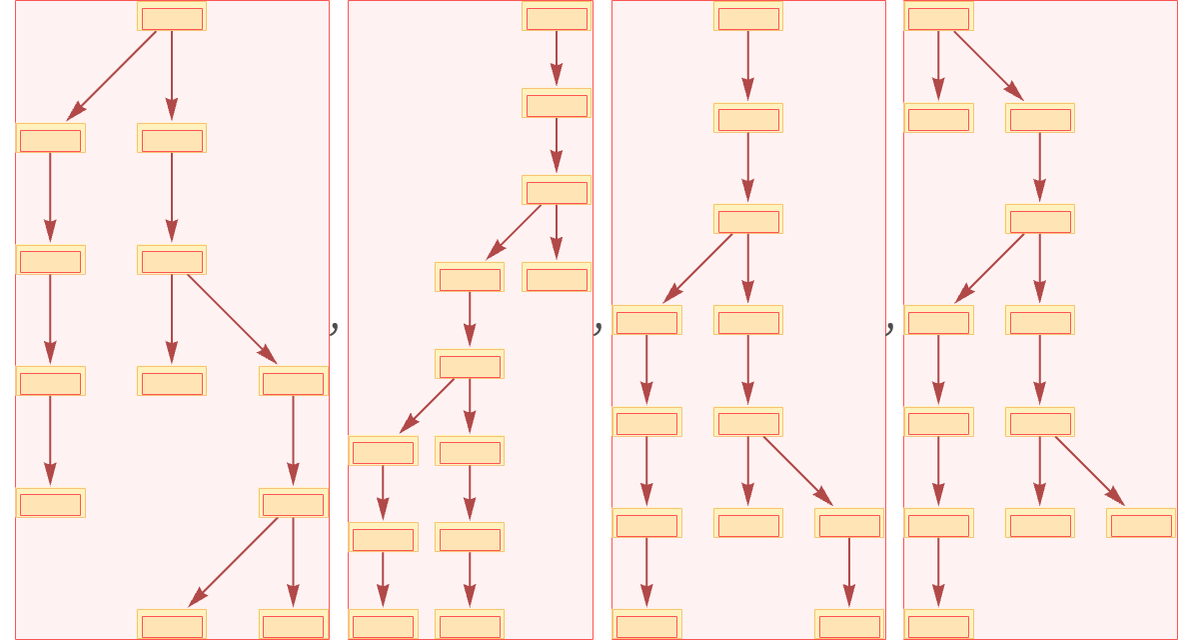
Here are the corresponding results after a few more updates:

This is a different rendering:

And this is what happens after many more updates (with a somewhat more systematic ordering):
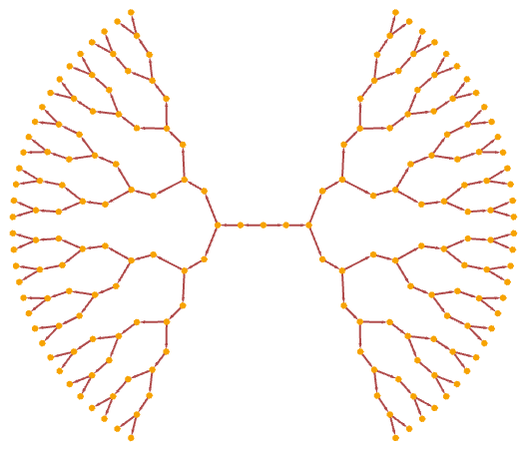
If we continued for an infinite number of updates, all these would give the same result—and the same infinite causal graph, just as we expect from causal invariance. But in the particular cases we are showing, they are being cut off in different ways. And this is directly related to the causal foliations we discussed in the previous subsection.
Here are examples of evolution with specific choices of updating orders:
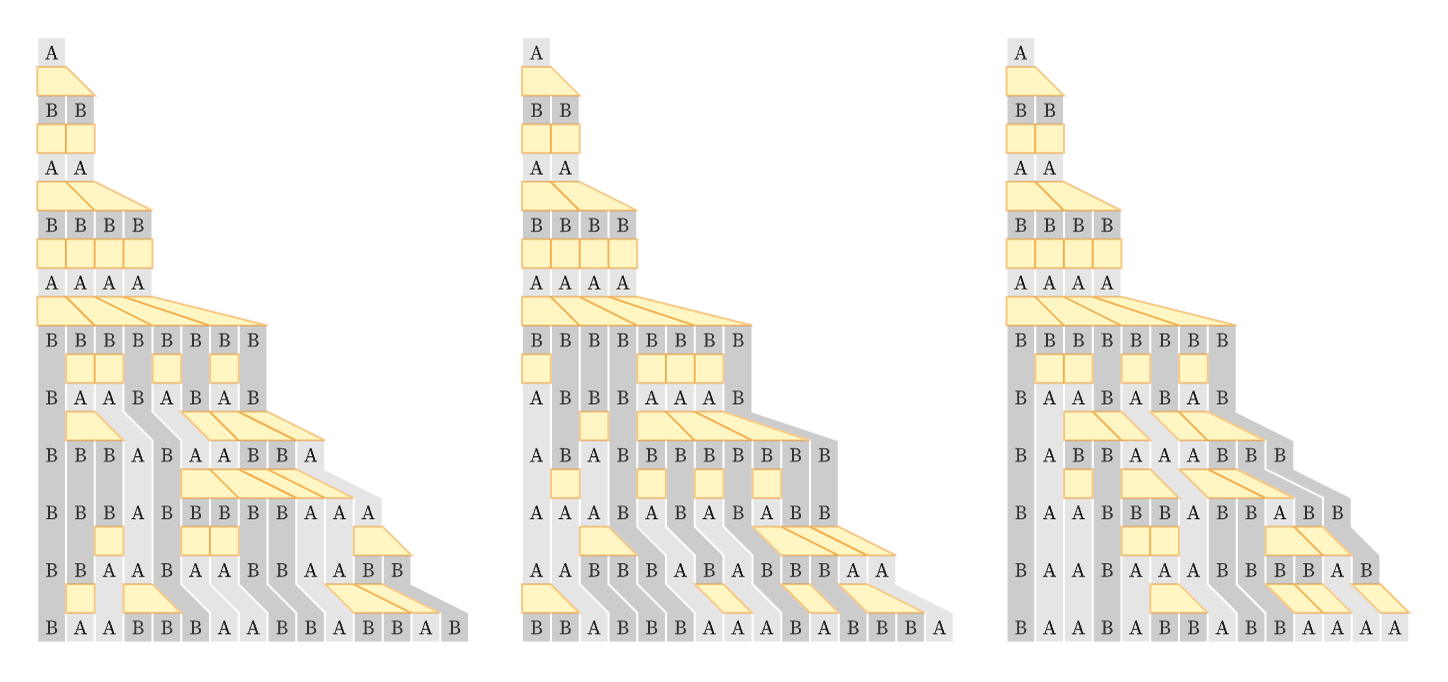
Adding causal graphs we get:
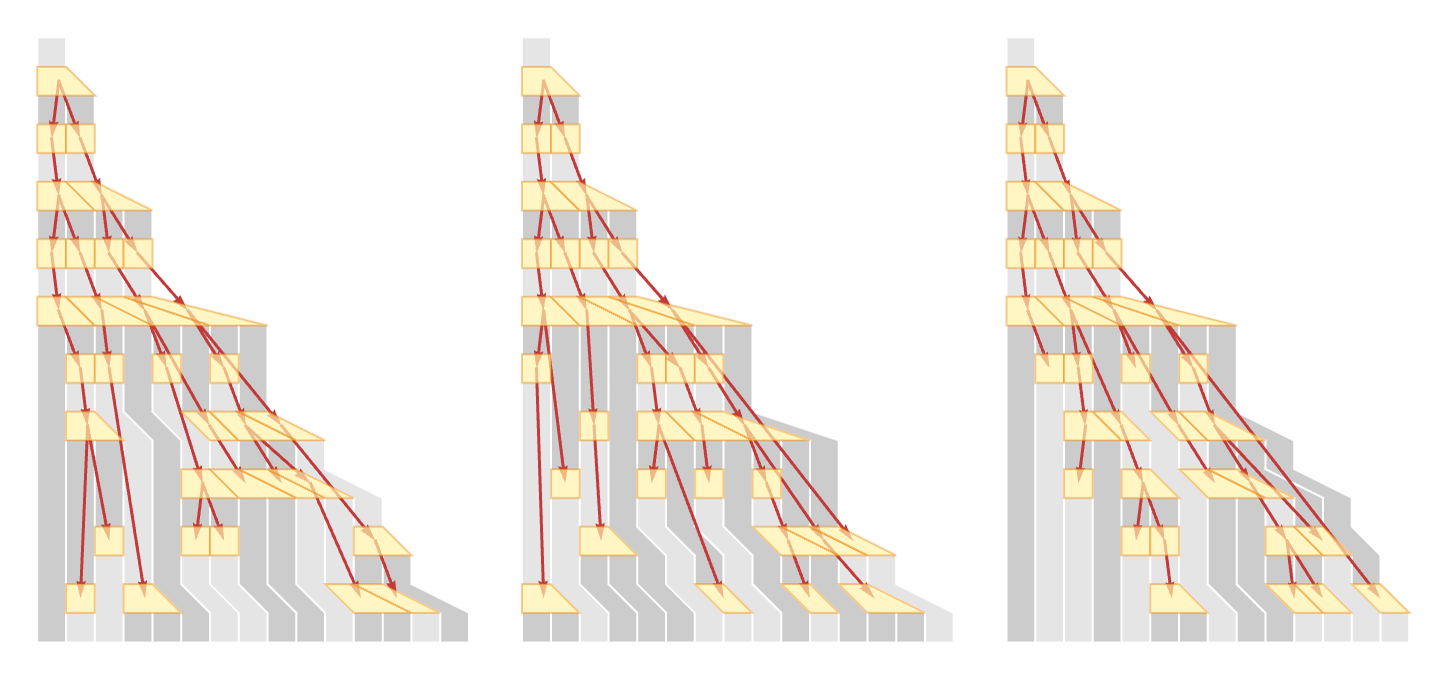
Here is what happens if we continue these for longer:
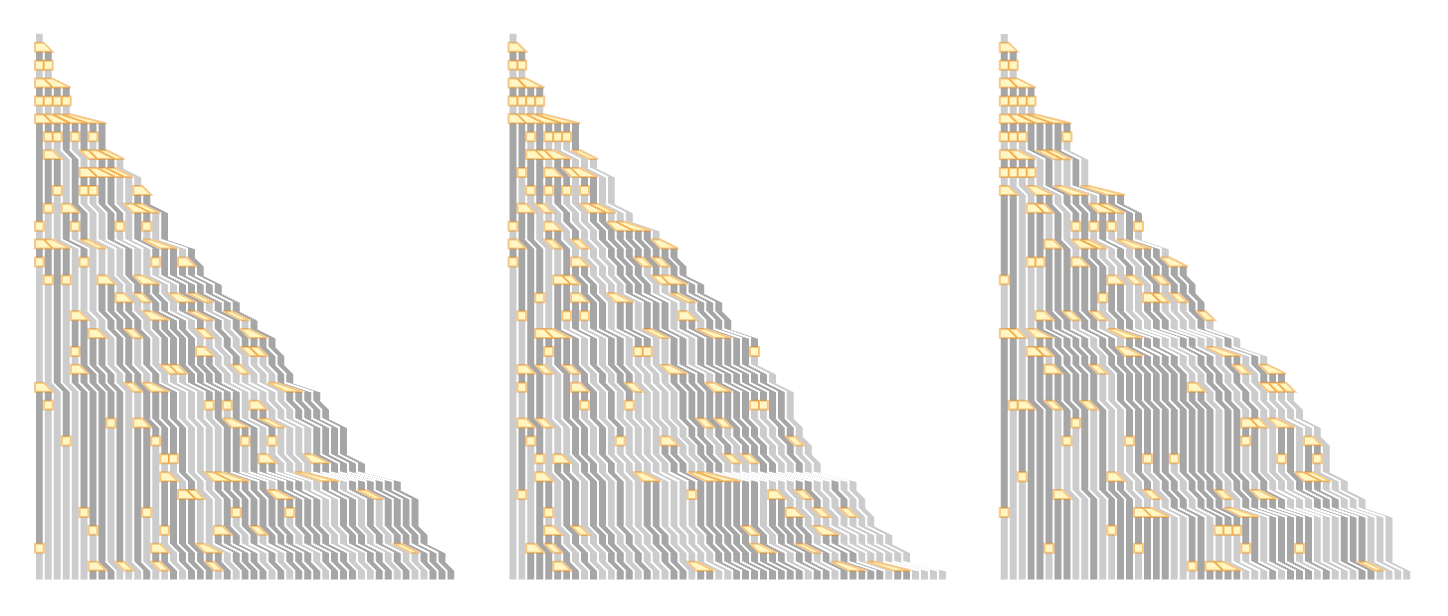
And here are the causal graphs that correspond to these evolutions:

 download pdf
  ARXIV
ARXIV peer review